Streamlining Network Visibility: Data Broker & Nexus Dashboard 4.2
3:16
Discover Cisco Data Broker is now integrated with Nexus Dashboard 4.2 to enhance network visibility, simplify traffic monitoring, and optimize your data center operations.
Related Videos
In Networking
-
Play video Closed-Loop Automated Troubleshooting
Closed-Loop Automated Troubleshooting
Stop chasing symptoms. Cisco AgenticOps correlates telemetry across device, network and application layers to isolate issues. AI Assistant resolves them automatically.
2:50
-
Play video Introducing Cisco Nexus Dashboard 4.2
Introducing Cisco Nexus Dashboard 4.2
Explore the latest features in Cisco Nexus Dashboard 4.2. Learn how this update enhances network automation, simplifies operations, and improves visibility across your data center.
2:13
-
Play video Mastering SAN Management with Cisco Nexus Dashboard 4.2
Mastering SAN Management with Cisco Nexus Dashboard 4.2
Discover how Nexus Dashboard 4.2 enhances SAN visibility and analytics. Streamline fabric management and troubleshooting with advanced insights in this 2-minute overview.
4:22
-
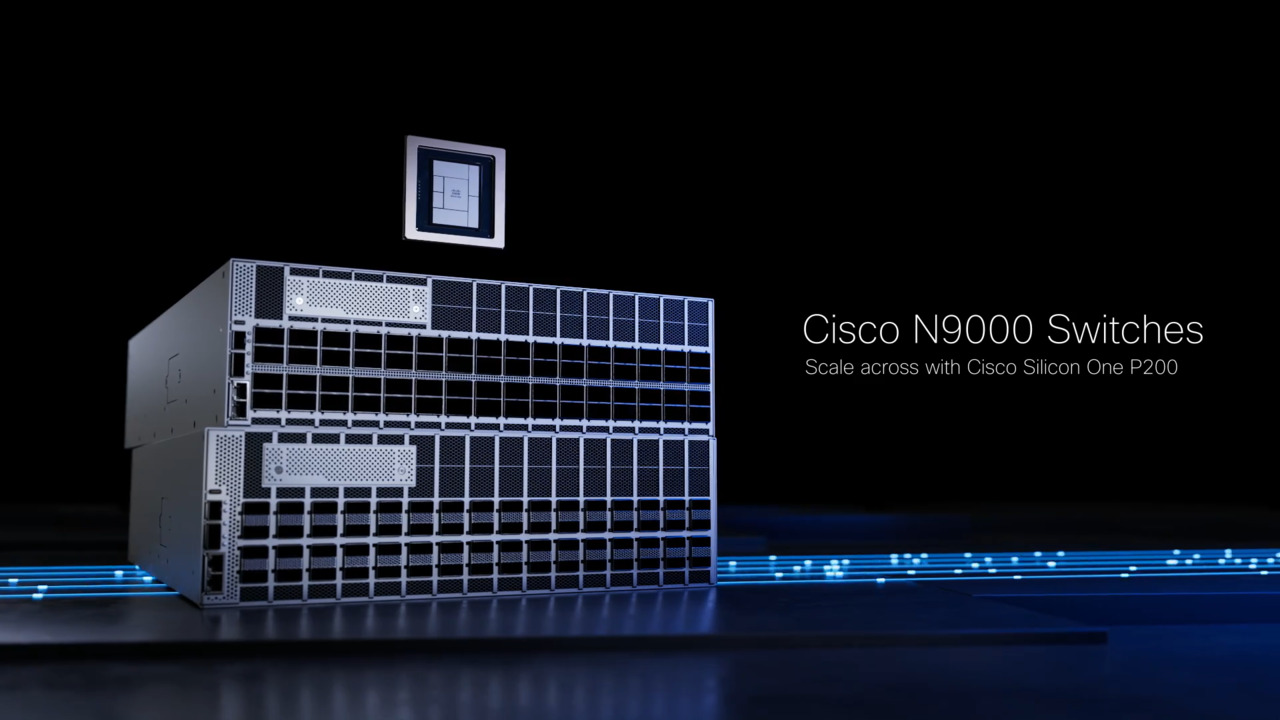
Play video The Switch for Your Distributed AI Needs
The Switch for Your Distributed AI Needs
Drive seamless Scale-Across 800G performance, superior power efficiency, and quantum-safe security for AI and traditional high-performance workloads.
2:00
-
Play video Unlocking Insights: Native Splunk Integration in Cisco Nexus Dashboard 4.2
Unlocking Insights: Native Splunk Integration in Cisco Nexus Dashboard 4.2
See how Native Splunk in Nexus Dashboard 4.2 simplifies data ingestion and visualization, empowering your network operations with real-time analytics and actionable insights.
1:52
-
Play video Cisco Nexus Dashboard 4.2: Introducing new IP Fabric for Media features
Cisco Nexus Dashboard 4.2: Introducing new IP Fabric for Media features
Explore how Cisco Nexus Dashboard 4.2 simplifies IP Fabric for Media. Learn to streamline broadcast network management, enhance scalability, and optimize media workflows today.
4:10